Weigh Scale Comparison Studies (2012-2017)
COVERLAB staff conduct field studies to answer questions regarding CMV scale accuracy. Answering questions like these assist the Patrol with enforcement compliance. For example:
- What are the measurable differences in scale accuracies between portable and/or mobile scales and permanent fixed scales?
- Are the differences statistically significant?
- If differences are discovered, what allowances in enforcement policy should be made to account for these differences?
- How can these differences be translated to enforcement policy?
- Are there measurable differences in weight accuracy using different methods of weighing dump trucks on portable and mobile scales?
Weigh scale comparison study examining measurable differences among CMV scale types in North Carolina (report not available for download)
Study examining measurable differences between of Mobile “Weigh-in-Motion” scale to permanent fixed scale (report not available for download)
Update to 2015 study examining measurable differences between of Mobile “Weigh-in-Motion” scale to permanent fixed scale (report not available for download)
Study that compares and evaluates a new procedure for weighing quad dump trucks on portable scales (report not available for download)
Linking Carrier Descriptive Attributes to Crash Patterns: An Untapped Tool in State Motor Carrier Safety Improvement Programs (2012)
A recent study by researchers at NC State University’s Institute for Transportation Research and Education (ITRE) has shown fatal crashes involving combination unit trucks (CUT) in NC for 2005-2009 were more frequent on non-Interstate roadways than on Interstate roadways. While small carriers (those operating fewer than 10 power units) constituted only 17% of all fatal CUT-involved crashes on Interstate roads, small carriers constituted 36% of all fatal CUT crashes on non-interstate roads.
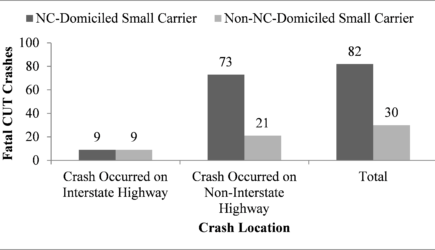
Most NC-domiciled small carrier fatal CUT crashes occur off interstate
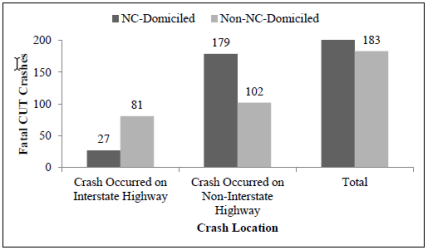
Most fatal CUT crashes occur off interstate and involve NC-domiciled carriers
Road Vulnerability Index (RVI) (2009)
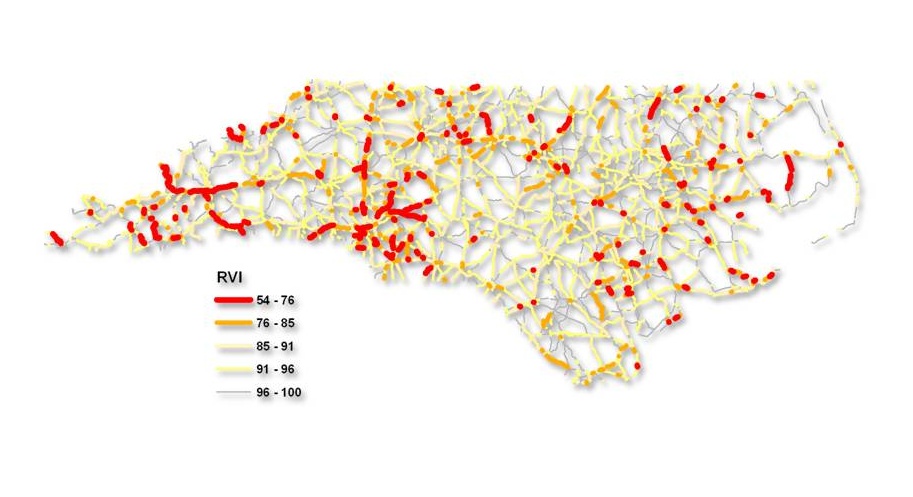
One component of North Carolina’s motor carrier enforcement program is focused on overweight trucks. The aim of this enforcement is to protect the State’s federally funded road and bridge infrastructure. As such, it is important to identify those facilities and roadway segments that are most susceptible to damage from overweight vehicles.
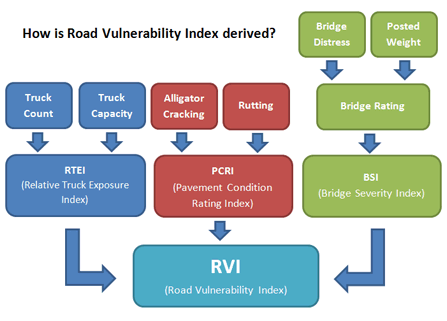
To this end, a quantitative Road Vulnerability Index (RVI) was developed. To develop the RVI, three factors were considered: truck volume, pavement condition, and bridge condition. By weighting these factors, vulnerability values were assigned to road segments statewide. Vulnerable road segments were then ‘mapped’ in the same GIS environment used to capture and display motor carrier enforcement activities for overweight violations.
Ticketing Aggressive Cars and Trucks (TACT) (2008-2009)
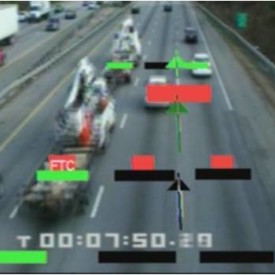
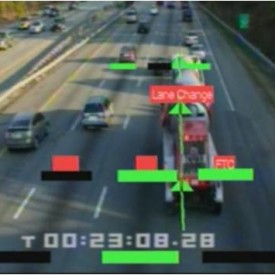
TACT is a safety program that is focused on ‘aggressive’ driver behaviors that take place in the ‘shared use’ car/truck operating environment. While ‘obvious’ violations (e.g., following to close, erratic lane change behavior, etc.) can be detected by direct visual observation, uniformed enforcement personnel are unable to provide continuous wide spread visual surveillance of the entire traffic stream moving through a corridor. The goal is to collect quantitative data to determine whether traditional enforcement methods combined with media and public education efforts are actually generating measurable changes in driver behavior on designated enforcement corridors (i.e. a lower rate of vehicles following too close or a lower rate of erratic lane changing).
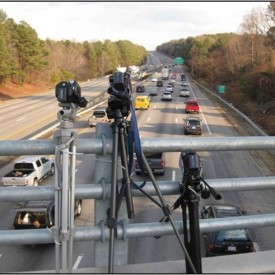
NCSHP and ITRE have experimented with automated video detection of aggressive behaviors, with an emphasis on speed and following too close. Cameras capture the number of trucks and cars per hour and per lane in continuous 8 hour observation periods. Mean truck and car speeds were aggregated by lane in 30-minute bins. Frequencies of follow-too-close (FTC) events by truck and by car, and by lane are generated and graphic comparisons of critical TACT behaviors (e.g., FTC) are conducted by vehicle type and lane for successive 30-minute periods.
Estimating the Off-Network Presence of STAA Dimensioned Vehicles on North Carolina Roadways Using CMV Crash Data, 2001-2005 (2007)
The study addresses the presence of commercial motor vehicle (CMV) involved crashes in North Carolina which took place off (i.e., beyond the 3-mile buffer) the truck network established by the Surface Transportation Assistance Act (STAA). All crash data were obtained from the North Carolina Department of Transportation’s Traffic Engineering Accident Analysis System (TEAAS). The data used in the study were for the period, CY2001-CY2005. Since it was not possible to reliably differentiate STAA ‘dimensioned’ vehicles using the trailer length field of the DMV-349 crash report form (due to large number of inaccurate or missing data), the dataset used for the analysis is confounded by the presence of trailers with trailer lengths (e.g., 48 ft) permissible ‘offnetwork.’
I-95 Corridor Study (2004)
This study, completed in August, 2004, presents map sheets which contain geospatial, graphical, and tabular data, as well as summary reports, representing heavy truck crashes on Interstate Highway 95 in North Carolina between January 1, 2001 and December 31, 2003. The study was undertaken by the GIS group of the Institute for Transportation Research and Education (ITRE) at North Carolina State University at the request of the North Carolina State Highway Patrol.

US Highway 74 Corridor Study (2004)
This study, completed in April, 2004, presents map sheets and selected tabular data representing heavy truck crashes along a specified corridor of US Highway 74 in Mecklenburg and Union Counties in North Carolina between January 1, 2001 and December 31, 2003.


